As previously mentioned, “The Redlining Archives of California Exclusionary Spaces,” visually illustrates how discriminatory policies implemented nationwide during the post-war helped to created segregated communities in California. The use of visual representation not only supports the theoretical discourse historians and other scholars have used to explain the systemic inequality of housing, but also gives a visual glimpse into a history that is hard to understand given the complexity of poverty within urban communities. The archive gives a brief redlining history by citing the book, The Possessive Investment in Whiteness – How White People Profit from Identity Politics, by George Lipsitz. The Archive highlights the two major factors to understand the history of American housing inequality from Lipsitz work when it states:
“The Home Owners Loan Corp. (HOLC) created in June 1933, introduced the long-term mortgage in practice today. HOLC systematized appraisal methods across the nation and initiated the practice of redlining. Through their appraisal and redlining practices, HOLC and FHA institutionalized exclusion and contributed to the fragmentation of communities.”[5]
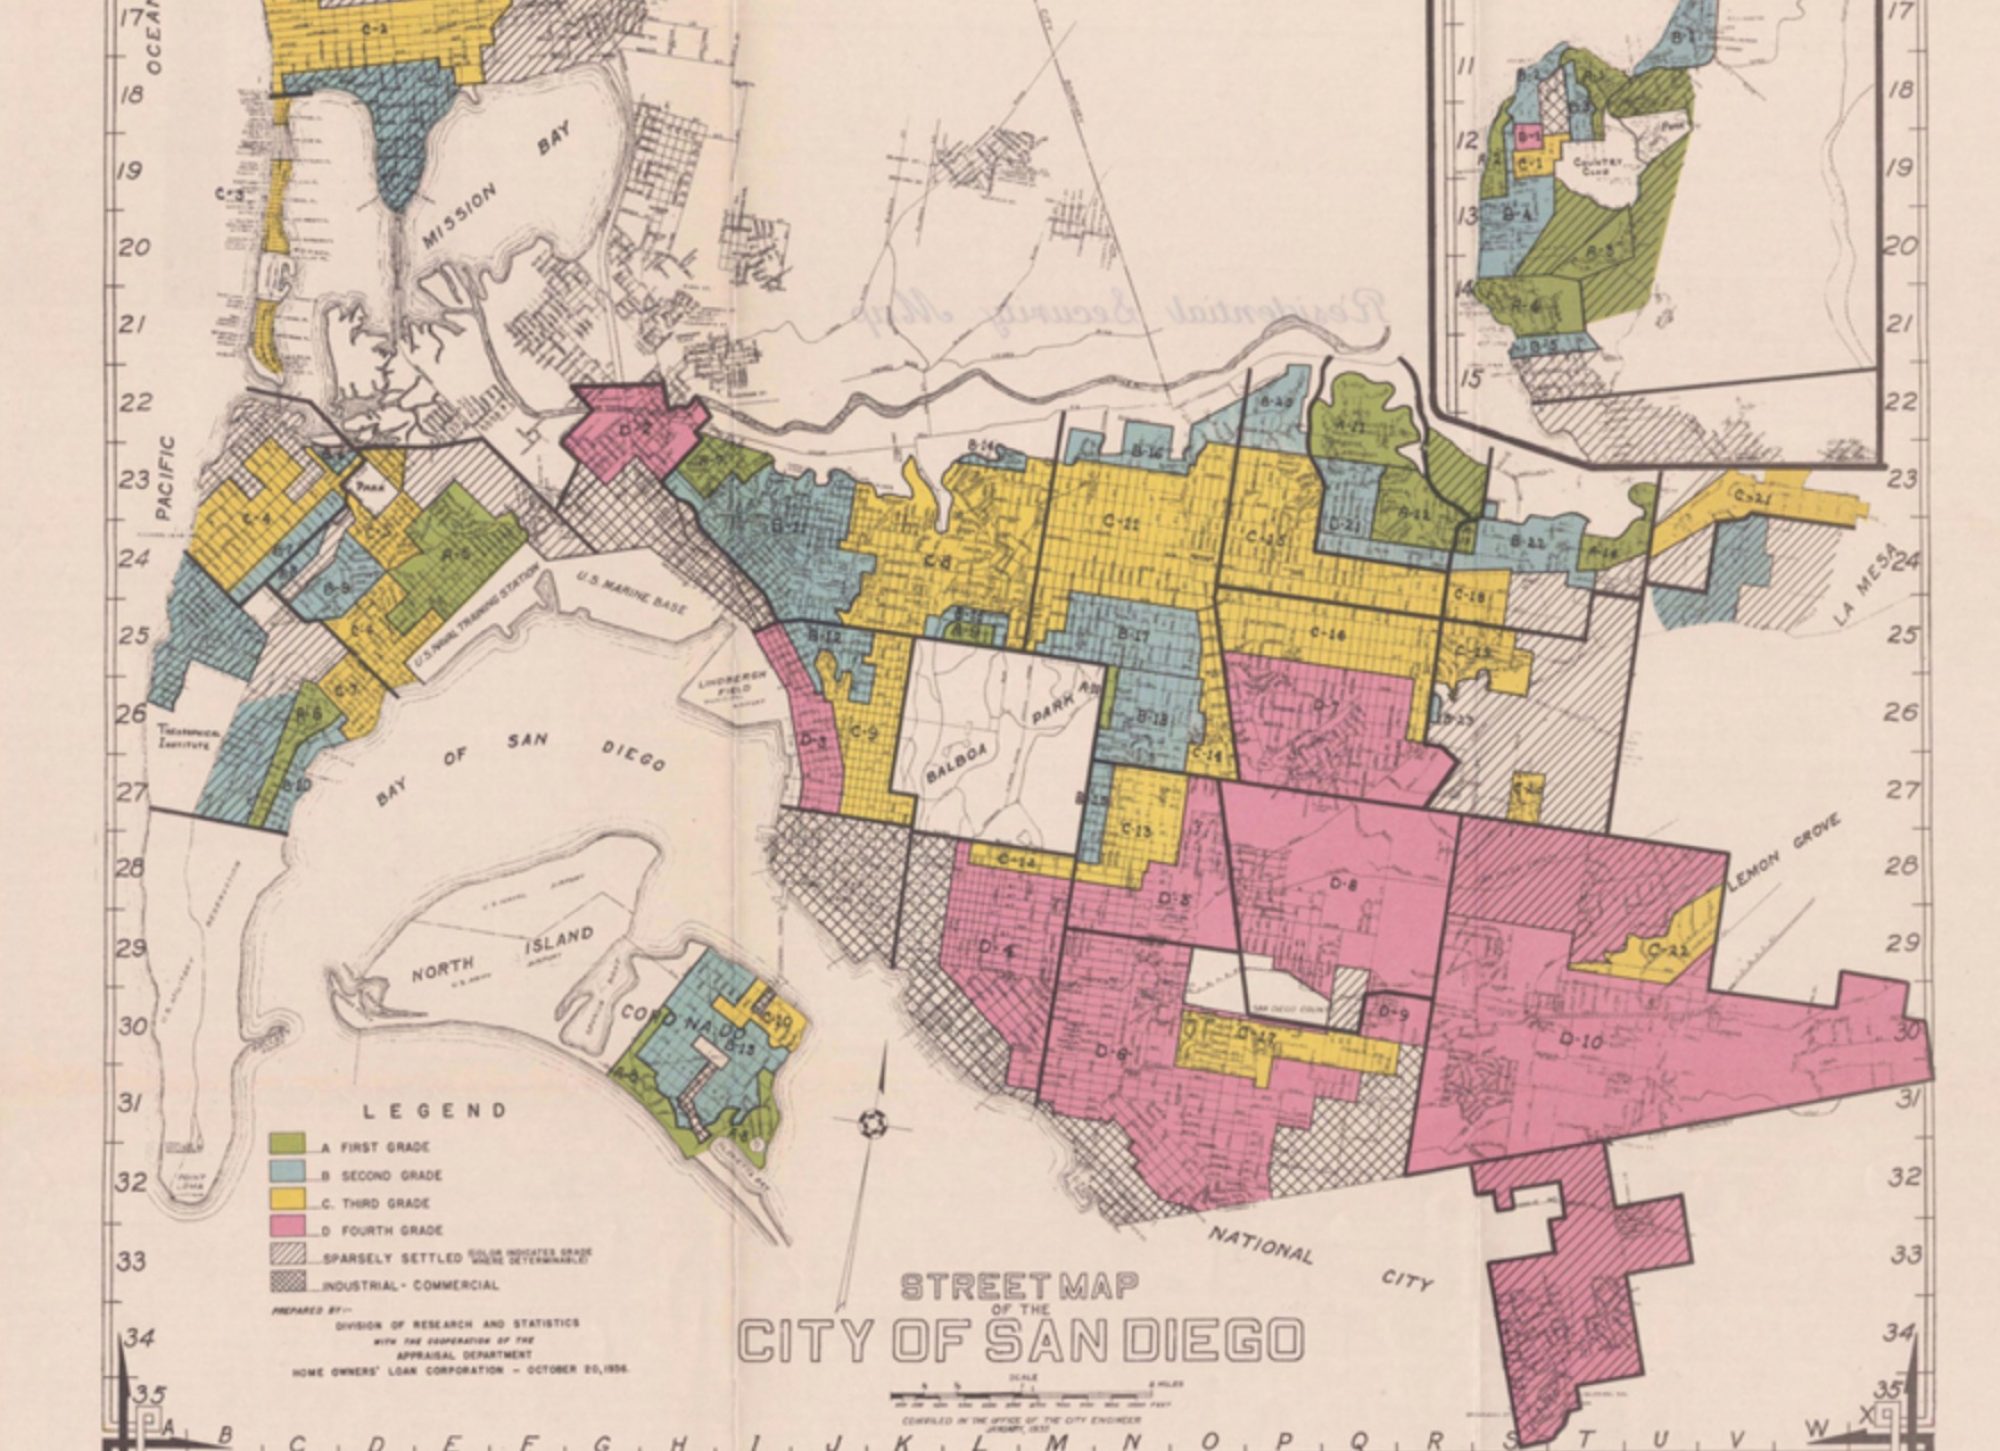
To support their claims that home mortgage loans were designed to discriminate against people of color and whites, the archive provided a color chart by the division of statistics federal home loan bank board. The chart signifies how redlining was systematically enforced in California and beyond. The images below exposed America’s prejudices within the institution of home loans. Given the fact, this document is government record, shows that the United States government knew these practices where a reality for the poor and people of color, and surprisingly over-time did nothing to eradicate the discrimination until the rise of the Civil Rights movement with the passing of the Civil Rights Act of 1964 and 1968. Please see the table below taken directly from the archive for review as well as the descriptions for the “Residential Security Map.”
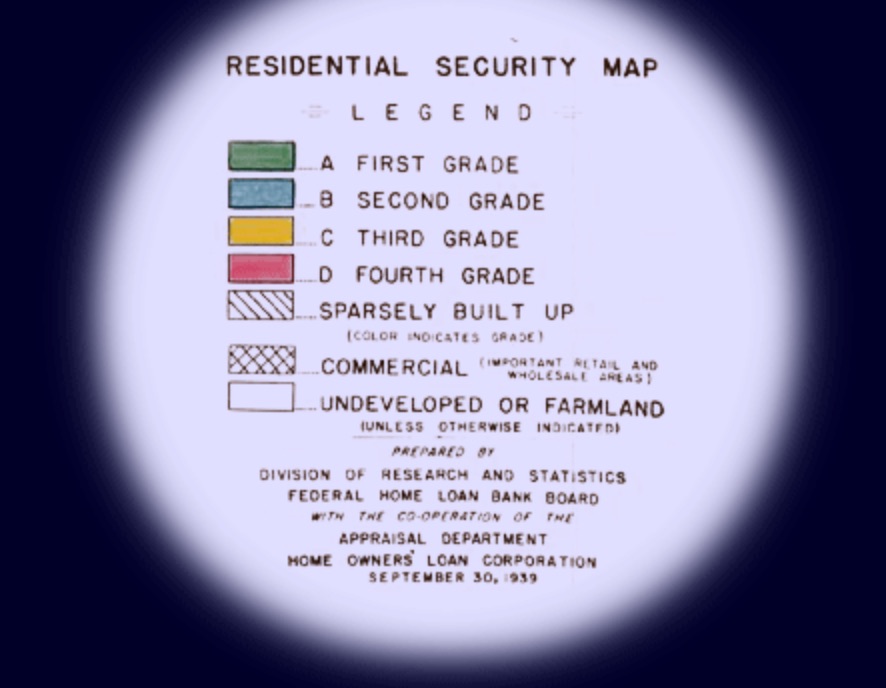

“Red areas represent those neighborhoods in which the things that are now taking place in the Yellow neighborhoods, have already happened. They are characterized by detrimental influences in a pronounced degree, undesirable population or infiltration of it. Low percentage of home ownership, very poor maintenance and often vandalism prevail. Unstable incomes of the people and difficult collections are usually prevalent. The areas are broader than the so-called slum districts. Some mortgage lenders may refuse to make loans in these neighborhoods and other will lend only on a conservative basis.”
“Yellow areas are characterized by age, obsolescence, and change of style; expiring restrictions or lack of them; infiltration of a lower grade population; the presence of influences which increase sales resistance such as inadequate transportation, insufficient utilities, perhaps heavy tax burdens, poor maintenance of homes, etc. “Jerry” built areas are included, as well as neighborhoods lacking homogeneity. Generally, these areas have reached the transition period. Good mortgage lenders are more conservative in the Yellow areas and hold loan commitments under the lending ratio for the Green and Blue areas.
“Blue areas, as a rule, are completely developed. They are like a 1935 automobile still good, but not what the people are buying today who can afford a new one. They are the neighborhoods where good mortgage lenders will have a tendency to hold loan commitments 10-15% under the limit.”
“Green areas are “hot spots“; they are not yet fully built up. In nearly all instances they are the new well planned sections of the city, and almost synonymous with the areas where good mortgage lenders with available funds are willing to make their maximum loans to be amortized over a 10-15-year period — perhaps up to 75-80% of the appraisal. They are homogeneous; in demand as residential locations in “good time” or “bad”; hence on the upgrade. “[6]
Based on the diagram above, we see how loans were assessed and residential maps were designed to ensure a certain demographic of people—people of color—would not have access to loans or certain neighborhoods due to racial bias. The language used in property deeds were passed down either generation from generation or each time a house was sold, which ensured systemic inequality persisted from the Great Depression to the 1960s. In San Diego for example, communities we know today were designed with racial segregation as an important piece to San Diego’s residential landscape. Cities such as La Jolla and Claremont ensured housing discrimination against African Americans, Mexicans, and Jews based on lending practices or deeds as described above.[7]